20|20
Visualize data in the cab
You cannot change what you cannot see. Let the 20|20 system lead you to better decisions as it monitors, controls, and diagnoses your field conditions and equipment performance in real-time.

From Knowledge to Ultimate Control
The 20|20 can be utilized as a monitor to simply set the planter but it also powers the most agronomically advanced systems on the market. The 20|20 does all this to give you the most accurate data to make crucial decisions and gives your equipment powerful automation to make decisions as it passes through the field, optimizing every pass.
High-Definition Agronomic Data
The Gen3 20|20 monitor provides the most advanced agronomic mapping you’ve ever seen. Optimize planting decisions with a smart, intuitive interface that visualizes performance and field conditions in real-time, seed by seed.
Customize display configurations, add sensors, and discover things about your field you may have never known.
Better Data, Better Decisions
The 20|20 gives you the knowledge that you need to maximize the performance of your equipment, your crops, and your farm. When you make better decisions for your next pass, you make better decisions next season, and throughout the future of your operation.
Take control of the data you collect and how you view it.
If you desire to see more metrics and maps side by side on your 20|20, then the 16" display is for you! Two times the widget locations and cross-display control of the most used home-screen features, so you can mount additional displays wherever makes the most sense in your cab.
Share swath coverage and maps across implements working in the same field with Passmaster. Synchronize all maps available on all implements between Gen 3 20|20 systems for the entire field. An annual Panorama subscription is required for this feature.
• View, share, and analyze 20|20 data everywhere.
• See data in row-by-row maps, field average reports, and yield comparisons.
• Automate the process of sending data from your 20|20 to other trusted platforms.
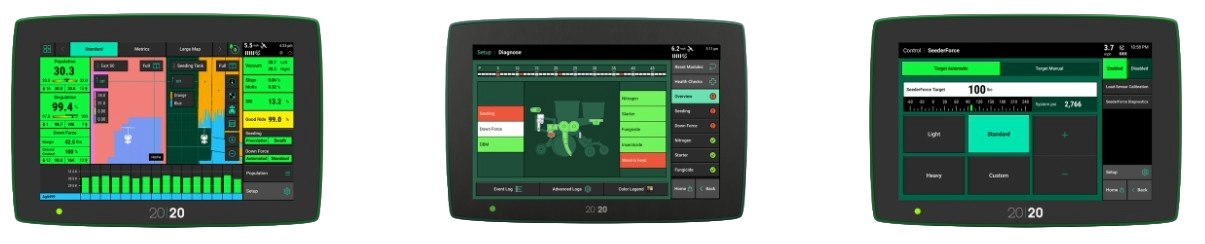
Map
High-definition maps illustrate detailed data per row. Show two maps side by side and product performance.
Control
Gain control over your most challenging applications through advanced products and automation capabilities.
Diagnose
Power and monitor electronic products through the 20|20 to see how they perform in real-time.
Ready to talk ?
Let’s help you get the most out of your equipment and technology. Reach out to our team today and let’s build solutions that keep your operation running at peak performance.
Contact us